Gold prices have risen sharply since early March, breaching the $2,000 level for the first time since last April.
Despite the Federal Reserve’s decisions to hike interest rates to a historic five percent, gold prices held the psychologically important $2,000 level and retested their mid-April highs on May 3, 2023.
So, is now the time to buy or sell?
What Really Drives Gold Prices?
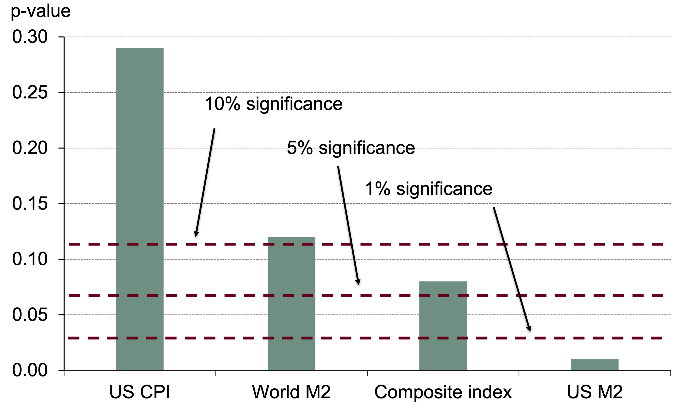
Many investors value gold as a hedge against inflation. But, while it has a solid long-term track record, its performance in the short term is less convincing. According to World Gold Council research, only 16% of the variation in gold prices can be explained by changes in consumer price index inflation. In other words, CPI inflation doesn’t seem to drive gold prices.

However, the same analysis found that gold prices are highly correlated with the M2 money supply, which reflects all currency held by the non-bank public plus savings and deposits and shares in retail money market mutual funds. In other words, gold prices increase proportionally to the amount of spendable money in circulation.
This explains its long-term effectiveness as a hedge. With a two to four percent real return since the 1970s, the growth in gold prices is consistent with the increase in the money supply and correlates more with economic growth and risk.
M2’s Record-Breaking Decline
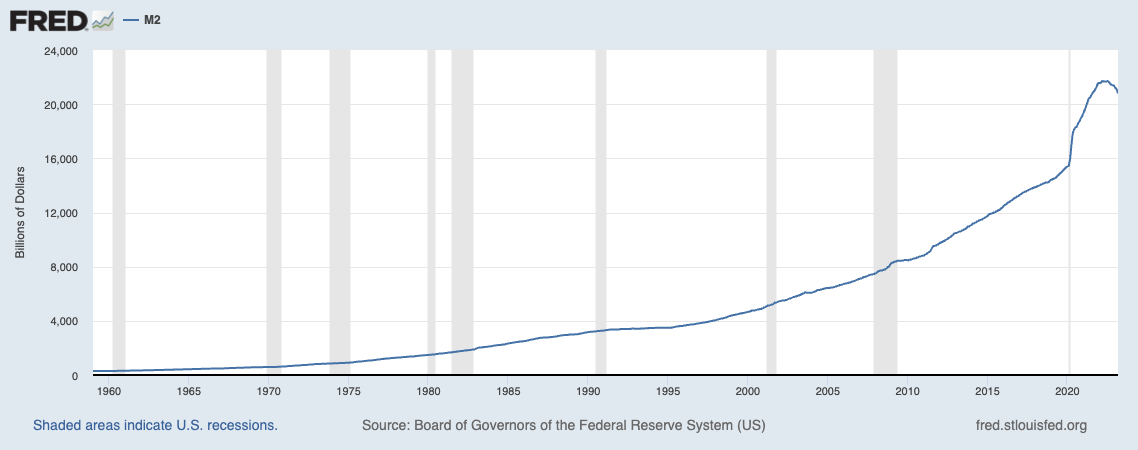
The M2 money supply surged by a historic 27% in 2020-2021, more than the 2008 financial crisis and World War II. But with the Federal Reserve raising interest rates, December was the first year-over-year M2 contraction ever. The decrease continued in January (-1.75%) and February (2.40%), the steepest drop in money supply yet.

Many economists expect the M2 money supply to fall again with the recent stress on the banking sector. However, inflation tends to lag the M2 money supply by one or two years, meaning inflation could remain elevated for a few months to a year. As a result, the Federal Reserve opted to continue raising rates to contain inflation in the interim.
What M2 Money Supply Means for Gold Prices
The historic decrease in the M2 money supply could be a harbinger of bad news for gold investors. While inflation could remain elevated for upwards of a year, the precious metal is more correlated with the M2 money supply, which has fallen since December. And there are few signs that it will recover in the near term.
In addition to the banking crisis, the Federal Reserve’s recent actions could take a toll on the M2 money supply over the coming months. Last year, the central bank announced plans to let securities ‘roll off’ of its balance sheet without reinvesting much of the principal it receives. And Jerome Powell doesn’t see a need to change these policies yet.
These trends could be bearish for gold prices, which tend to mirror the M2 money supply.
How to Bet on Gold and Its Alternatives
Exchange-traded funds (ETFs) have made it easy to bet on an increase or decrease in gold prices without buying futures contracts. For example, you could take a contrarian position in gold with short or ultrashort ETFs and buy the rebound with long gold commodity ETFs. There is also an option to invest in physical gold ETFs that don’t rely on futures contracts at all.
Lastly, investors seeking a more effective hedge against inflation may want to consider other alternatives, including treasury inflation protected securities or TIPS, equity strategies expected to benefit from rising rates or other actively managed strategies that can invest in a broad range of inflation-hedging commodity futures rather than exclusively gold.
Here are the lists of mutual funds and ETFs, sorted by their YTD performance.
Long Gold Commodities
| Name | Ticker | Type | Active? | AUM | YTD Ret (%) | Expense |
| GraniteShares Gold Trust | BAR | ETF | No | $0.99 Bn | 10.9% | 0.17% |
| SPDR Gold MiniShares Trust | GLDM | ETF | No | $5.15 Bn | 10.8% | 0.10% |
| abrdn Physical Gold Shares ETF | SGOL | ETF | No | $2.64 Bn | 10.8% | 0.17% |
| iShares Gold Trust | IAU | ETF | No | $30.7 Bn | 10.7% | 0.25% |
| Goldman Sachs Physical Gold ETF | AAAU | ETF | No | $0.56 Bn | 10.7% | 0.18% |
| SPDR Gold Shares | GLD | ETF | No | $63.1 Bn | 10.6% | 0.40% |
| Gold Bullion Strategy Investor | QGLDX | Mutual Fund | Yes | $0.15 Bn | 9.4% | 1.42% |
Don’t forget to check out other Long Gold Commodity based mutual funds and ETFs.
Long Gold Equities
| Name | Ticker | Type | Active? | AUM | YTD Ret (%) | Expense |
| VanEck Gold Miners ETF | GDX | ETF | No | $12.6 Bn | 23.4% | 0.51% |
| USAA Precious Metals and Minerals | USAGX | Mutual Fund | Yes | $0.58 Bn | 22.4% | 1.12% |
| Gabelli Gold A | GLDAX | Mutual Fund | Yes | $0.37 Bn | 20.9% | 1.49% |
| VanEck International Investors Gold A | INIVX | Mutual Fund | Yes | $0.80 Bn | 19.6% | 1.34% |
| Oppenheimer Gold & Special Minerals A | OPGSX | Mutual Fund | Yes | $2.17 Bn | 18.5% | 1.05% |
| Fidelity Advisor® Gold A | FGDAX | Mutual Fund | Yes | $1.63 Bn | 18.5% | 1.07% |
| Sprott Gold Equity Investor | SGDLX | Mutual Fund | Yes | $0.97 Bn | 18.4% | 1.41% |
| VanEck Junior Gold Miners ETF | GDXJ | ETF | No | $4 bn | 17.6% | 0.52% |
| First Eagle Gold A | SGGDX | Mutual Fund | Yes | $2.18 Bn | 17.3% | 1.22% |
| Franklin Gold and Precious Metals A | FKRCX | Mutual Fund | Yes | $1.23 Bn | 17.3% | 0.90% |
Explore mutual funds and ETFs from the Precious Metals Industry to consider more equity options.
Short Gold
| Name | Ticker | Type | Active? | AUM | YTD Ret (%) | Expense |
| DB Gold Short ETN | DGZ | ETF | No | $0.003 Bn | -8.4% | 0.75% |
| ProShares UltraShort Gold | GLL | ETF | No | $0.03 Bn | -17.1% | 0.95% |
| DB Gold Double Short ETN | DZZ | ETF | No | $0.005 bn | -17.7% | 0.75% |
Other Inflation-hedging Alternatives
| Name | Ticker | Type | Active? | AUM | YTD Ret (%) | Expense |
| WisdomTree Managed Futures Strategy ETF | WTMF | ETF | Yes | $0.15 Bn | 7.7% | 0.65% |
| DFA Inflation-Protected Securities I | DIPSX | Mutual Fund | Yes | $6.93 Bn | 4.3% | 0.11% |
| TIAA-CREF Inflation Link Bd Instl | TIILX | Mutual Fund | Yes | $2.93 Bn | 3.5% | 0.25% |
| iShares TIPS Bond ETF | TIP | ETF | No | $31.9 Bn | 3.4% | 0.19% |
| Vanguard Inflation-Protected Secs Inv | VIPSX | Mutual Fund | Yes | $38.3 Bn | 3.2% | 0.20% |
| American Funds Inflation Linked Bd A | BFIAX | Mutual Fund | Yes | $13.6 Bn | 3.0% | 0.67% |
| BlackRock Inflation Protected Bond Inv A | BPRAX | Mutual Fund | Yes | $3.21 Bn | 3.0% | 0.60% |
| FlexShares iBoxx 3Yr Target Dur TIPS ETF | TDTT | ETF | No | $2.14 Bn | 3.0% | 0.18% |
| Vanguard Short-Term Infl-Prot Secs ETF | VTIP | ETF | No | $61.7 Bn | 2.6% | 0.04% |
| PIMCO 1-5 Year US TIPS ETF | STPZ | ETF | No | $1.6 Bn | 2.6% | 0.20% |
| T. Rowe Price Ltd Dur Infl Focus Bd | TRBFX | Mutual Fund | Yes | $9387 Bn | 2.3% | 0.39% |
| SPDR® SSgA Multi-Asset Real Return ETF | RLY | ETF | Yes | $0.43 Bn | -0.1% | 0.50% |
| Horizon Kinetics Inflation Beneficiaries ETF | INFL | ETF | Yes | $1.28 Bn | -1.5% | 0.85% |
The Bottom Line
Gold prices could start to retreat if the M2 money supply is any indicator. However, the money supply and its impact on inflation isn’t the only factor that could influence gold prices. For example, a flight to safety or a move away from dollar reserves could send gold prices higher. But with the M2 money supply on the decline, investors may want to consider diversifying their inflation-hedging exposure away from exclusively gold.


