JPMorgan launched the JPMorgan Active Growth ETF (JGRO) last week, adding to its growing line-up of actively-managed ETFs. The new fund will take a bottom-up approach to identify companies with growth potential that the market fails to appreciate.
Let’s take a closer look at the fund’s attributes and holdings to see if it could have a home in your portfolio.
See our Active ETFs Channel to learn more about this investment vehicle and its suitability for your portfolio.
A Quick Introduction
The JPMorgan Active Growth ETF employs a fundamental, bottom-up approach to identify companies with underappreciated growth potential. While its primary focus is on large-cap equities, the fund may source opportunities across the entire market cap spectrum. The goal is to deliver a style-pure growth equity portfolio.

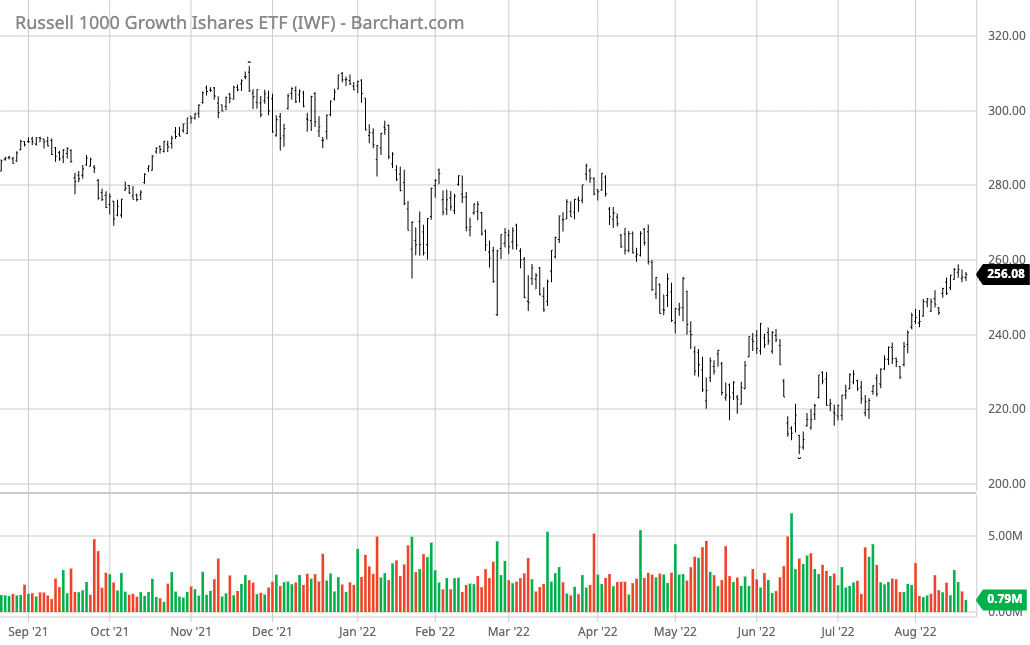
The JPMorgan Active Growth ETF’s benchmark, the Russell 1000 Growth Index, experienced a significant decline during the first half of 2022 alongside the broader tech sector. Source: Barchart.com.
The fund’s 0.44% expense ratio makes it cheaper than the 0.69% average across all actively-managed ETFs, according to ETF.com. While the cost is higher than the iShares Russell 1000 Growth ETF (IWF) with its 0.18% expense ratio, JGRO’s active approach could offer superior risk-adjusted returns that make the added cost worthwhile.
What's in the Fund?
The JPMorgan Active Growth ETF aims to outperform the Russell 1000 Growth Index. Not surprisingly, information technology is the largest sector weighting for both the ETF and index at 44.42% for the index and 36.6% for the ETF. But interestingly, the fund is heavily overweight in financials relative to its benchmark index.
Here are the top five sectors in which JGRO has an exposure:
| Sector Name | JGRO | IWF |
|---|---|---|
| Information Technology | 36.60% | 44.42% |
| Health Care | 16.01% | 11.02% |
| Consumer Discretionary | 15.40% | 16.90% |
| Industrials | 8.10% | 7.04% |
| Communication | 6.10% | 7.66% |
Data as of August 18, 2022.
While the ETF holds just 128 equities (less than the index’s ~500 holdings), only six holdings account for more than 2% of the overall portfolio. By comparison, the Russell 1000 Growth Index has eight holdings that account for more than 2% of the portfolio, including a nearly 13% allocation to Apple Inc. stock alone!
The JPMorgan Active Growth ETF also has a lower price-earnings ratio (22.07x), price-sales ratio (2.36x), and price-cash flow ratio (13.31x) than its benchmark index and category average. These dynamics could suggest that its holdings have more room to run in terms of multiple expansions and a margin of safety on the downside.
The Bottom Line
JGRO represents JPMorgan’s latest foray into actively-managed funds. With its bottom-up approach, the fund managers aim to identify companies with underappreciated growth potential. Currently, its portfolio is overweight in healthcare companies with a more compelling valuation than the Russell 1000 Growth Index.
Take a look at our recently launched Model Portfolios to see how you can rebalance your portfolio.


