When it comes to income investing, there are five powerful formulas investors use to evaluate dividends. These include the dividend yield, annualized payout, payout ratio, dividend growth and the Dividend Advantage Rating System (DARS).
These five formulas are presented at the top of every ticker page on Dividend.com. Using health blue-chip Johnson & Johnson (JNJ ) as an example, the formulas are presented as follows:

While this article focuses mainly on dividend growth rate, the other formulas are of paramount importance for dividend investors. In the case of dividend growth, the number of years in which payouts has been increasing is also important. This figure is used to calculate dividend aristocrats and to compute the future dividend aristocrat list. You can screen all stocks that are dividend aristocrats in our Dividend Screener. You can also apply 16 more dividend-specific criteria as you filter out your research. Click here to find out which 10 companies are likely to be dividend aristocrats by 2050.
The other four calculations – dividend yield, annualized payout, payout ratio and DARS rating – are also critical to analyzing a stock’s performance from a dividend perspective.
Dividend Yield
Simply stated, a security’s dividend yield is calculated by taking its dividend-per-share and then dividing it by its price-per-share. The result is conveyed in percentage terms, and that is your dividend yield. Since the yield for the current year isn’t known, it is usually obtained by estimating the previous year’s yield or by using the latest quarterly yield, multiplying it by four (adjusting for seasonality) and dividing by the security’s current share price.
Annualized Payout
The annualized payout of a stock is simply the dividend amount that is paid out each period. In the JNJ example, the annualized dividend payout is $3.20 per share. This corresponds to the dividend yield of 2.86%. In other words, they both convey the same information, just in different forms.
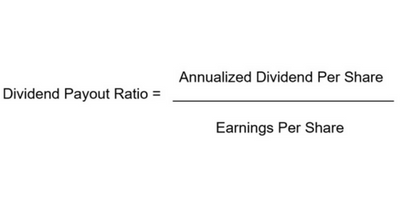
Payout Ratio
The payout ratio, on the other hand, is the percentage of earnings paid to shareholders in dividends. It is calculated using the following formula:

DARS
The Dividend Advantage Rating System (DARS) is a proprietary rating system used by Dividend.com to evaluate companies based on their yield and overall performance. The DARS rating is comprised of five factors: relative strength, overall yield attractiveness, dividend reliability, dividend uptrend and earnings growth. Each factor is ranked on a five-point scale to determine a stock’s overall rating. DARS ratings are available to premium users.
How to Calculate the Growth Rate of a Dividend
Learning how to calculate dividend growth is an essential part of income investing. The rate at which stocks pay out dividends can help you determine whether they are appropriate for your portfolio. In the following section, we highlight the ways in which dividend growth is calculated and how you can apply that method to your investing strategy.
The dividend growth rate refers to the annualized percentage change that a security’s dividend undergoes over a specific period of time. Growth rates can be based on any interval and can be calculated linearly by taking the average change over that specific period.
To calculate a dividend’s growth rate, you first need the security’s dividend history. This information can be obtained through the company page on Dividend.com.

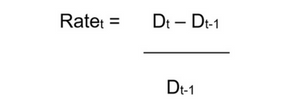
The dividend growth rate can then be calculated using the following formula:

Where “Rate in time period t” is equal to “dividend in time period t” minus “dividend in time period t – 1”, divided by the “dividend in time period t – 1”.
This formula helps investors determine the annualized change that a stock’s dividend undergoes on a year-over-year basis. Companies with positive year-over-year dividend growth are considered strong dividend stocks. In the case of Johnson & Johnson, the stock has experienced year-over-year dividend growth for 53 consecutive years. (In other words, JNJ’s dividend has grown every year since 1953.) Therefore, income investors usually look at dividend growth in terms of years to determine the attractiveness of a particular stock as opposed to simply looking at the percentage growth of that dividend.
The following is an example of JNJ’s dividend payments and linear dividend growth rates over a five-year period:
| Year | Dividend Amount | Yield (%) | Growth Rate |
|---|---|---|---|
| 2011 | $2.25 | 3.43% | N/A |
| 2012 | $2.40 | 3.42% | 6.70% |
| 2013 | $2.59 | 2.83% | 7.90% |
| 2014 | $2.76 | 2.64% | 6.50% |
| 2015 | $2.95 | 2.87% | 6.90% |
In 2015, JNJ’s dividend amount grew by 6.9%. The dividend growth rate was 6.5% for 2014 and 7.9% for 2013.
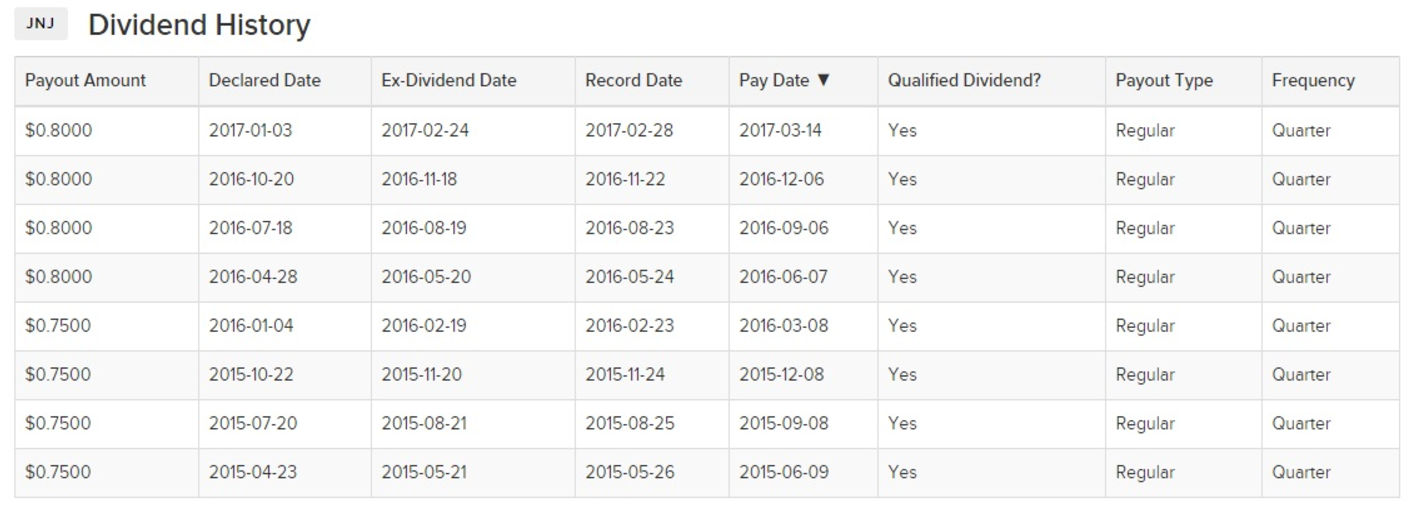
As you can see, the growth rate is calculated by comparing a calendar year dividend to the previous calendar year dividend. Dividend.com makes a stock’s growth history and dividend history easy to obtain and compare. Once again using Johnson & Johnson as an example, premium users can easily navigate the stock’s dividend history.

Annual dividend amounts for JNJ appear as follows:

Historical annual dividend data are available for premium members only. Through a premium membership, users can also download annual payout history for every company. While historical annual payout data goes back to 1993, our calculation of dividend growth rate in years uses numbers that go back earlier than that.
Why Dividends Matter
As John D. Rockefeller once famously said, “The only thing that gives me pleasure is to see my dividend coming in.”
Dividends Say a Lot About a Company
Dividend growth says a lot about a company, and it is one of the principal ways businesses communicate financial health and shareholder value. Dividends send a clear and powerful message about the maturity of a company, its performance and its overall prospects. After all, companies with the ability to pay out profits and increase the size of those payments over time usually exhibit solid fundamentals. Companies that pay out dividends are serious about attracting investors and retaining their loyalty by rewarding them with consistent payments.
The Importance of Dividend History
When it comes to stock investing, the longer the history of consecutive dividend increases, the higher the probability that the company will not cut its dividend during bad times. This is critical information for investors looking to diversify away from cyclical market risks and recessions.
Investors can calculate their expected dividend growth rate in the future by using the dividend growth history table on Dividend.com. Using the JNJ example, the table looks like this:

The Downside of Dividend Growth
However, investors should note that a long history of growing dividend payments isn’t always a good thing for companies because it means they may be forced to increase their payouts during harsh economic times when it otherwise wouldn’t be feasible. This can push the payout ratio beyond 100% or below zero. Crashing oil prices over the past two-and-a-half years pushed dividend yields significantly higher for leading oil companies even as their underlying fundamentals deteriorated. As many of these companies laid off thousands of workers and saw their stock prices plunge, they were still forced to pay higher dividends just to maintain their reputation. This just shows that an unrelenting commitment to dividend growth isn’t always positive.
Not Every Dividend Play Experiences Dividend Growth
Investors should remember that stocks don’t always record dividend growth due to a myriad of factors such as poor performance. While a stock that experiences zero dividend growth is better than the one that experiences a dividend cut, both are signs of a deteriorating financial position. This may include weaker or declining earnings or a limited amount of funds to meet dividend payment requirements. This may only be temporary, but often makes the stock less appealing to investors.
A Word of Caution About Dividend Growth
While dividend growth provides a good benchmark for choosing stocks, investors should use this number with caution. Companies often announce dividend cuts mid-year, and this wouldn’t be reflected in our dividend growth number until we compute the total dividend for that year and then compare it with the previous 12 months. This figure would only be updated once we complete the entire calendar year. In the meantime, investors should check the quarterly payout history to review the most recent trend.
Investors interested in exploring dividends in greater depth should review our Dividend University section for a more granular analysis of the basics of dividend investing. Also be sure to check out the 40 essential things every dividend investor should know apart from dividend growth rates.
The Bottom Line
Dividend growth says a lot about a compan, and should be evaluated carefully by investors looking for solid income plays in a highly volatile market. Dividend.com has two important tools for dividend investors: The 25-Year Dividend Increasing tool and the 10-Year Dividend Increasing tool. These tools find companies that have consecutively grown their dividends for 25 years and ten years. Both these tools also mention the number of years of dividend growth shown by the companies, the latest dividend yields and the latest ex-dividend dates. You can download both these lists in a spreadsheet as you do your analysis.
As a premium member, you receive a daily dividend newsletter that brief you on the latest happenings in the dividend world. More than 100,000 investors have subscribed. Go premium for free by starting a free 14-day trial.


