Investors in stocks are often looking for income from their investments to help support their lifestyle. For these investors, dividends are an important component of selecting investments. Not all stocks pay dividends of course, but for those that do, there are five key factors that investors should know about.
Take Ford Motor Company (F ) for instance – the firm’s data from Dividend.com is shown below.

The Dividend.com page shows us five key factors that we care about when considering Ford’s stock.
- First, on the far left, we have the stock’s dividend yield. In Ford’s case, that yield is 5.21%, which is a healthy yield – most stocks typically have yields of around 2%. Ford might have a high yield for a number of reasons, but chief among them are because the firm could be risky or because the firm is paying out most of its profits in dividends.
- Then we have the annualized payout. In Ford’s case, this figure is $0.60. If you own one share of stock in Ford, that is how much cash you can expect to receive over the next year.
- Next up we have the firm’s payout ratio. This tells us how much of the firm’s profit is being paid out as dividends. In Ford’s case, the payout ratio figure is 38.7%.
- Ford seems like a good opportunity in that they have a relatively high dividend, but one potential drawback is that the firm does not seem to be growing its payout rapidly over time. The Dividend Growth section in the above screenshot demonstrates this.
- Finally, the fifth box is the DARS ranking, which is exclusively for Premium users of Dividend.com. This proprietary metric ranks Ford based on its safety and return potential for investors.
In this article, we will be looking more closely at the annualized payout metric and why a special situation – an annualized payout of $0 – may occur under certain situations.
Learn more about dividend payout ratio here.
What Is a Payout?
The annualized payout is the expected amount of cash that a holder of one share of the stock would receive in the current year. That cash payout is given out of a firm’s earnings.
Investors often compare firms against one another on the basis of their annualized payouts or their dividend yields. That’s a useful approach, primarily if the two firms are similar in some way that investors care about, such as their level of risk.
Investors also often compare the payout of a firm to the company’s EPS to see if that payout is sustainable. The reality is that the payout of a company can only be compared to EPS of the same company if both these factors use the same time period. If investors use different time periods for dividends and EPS metrics, they risk conflating different trends, which are influencing the stock during different periods.
Investors interested in finding specific opportunities around rate hikes should consider drilling down and looking at specific sectors to find good opportunities. From our Dividend Screener you can screen stocks by utilities, REITS, banking, financial, and other sectors and industries as you do your research on stocks that you should play in a rising interest-rate environment. You can also download the entire list in a spreadsheet as you look for investment ideas.
What Is an Annualized Payout?
The annualized payout is the dollar amount that investors can expect to receive this year from holding one share of the stock. Most investors own a lot more than a single share in a stock though. In these cases, multiply the number of shares held by the expected payout. For instance, if you hold 100 shares in a stock, and you want to determine the total cash payout expected from that investment, just multiply the annualized payout times 100.
Want to know more about how rising rates might impact stocks? Check out ETFdb.com’s superpage on rising interest rates.
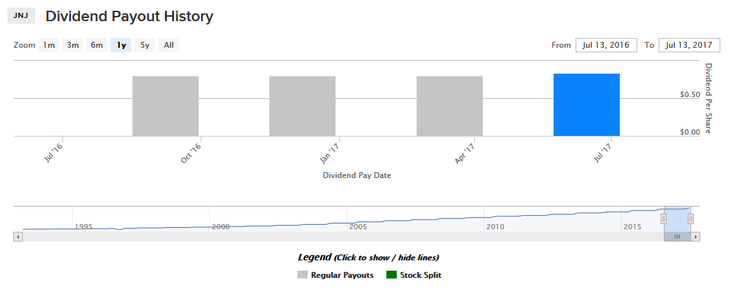
To determine the annualized payout for stocks with a steady and stable dividend, simply multiply the dividend per period by the number of periods in a year. For example, Johnson and Johnson (JNJ ) recently increased its payout from $0.80 per quarter to $0.84 per quarter. Since there are four quarters in a year, this means that JNJ has an annualized payout of $3.36.

Companies have significant leeway in determining how much their dividends will be. In its most recent quarter, JNJ earned net income of $4.42 billion. This eventually translates to an adjusted diluted earnings of $1.83 per share. While earnings vary quarter by quarter, JNJ feels comfortable enough with the trends in its business that it believes it can safely pay $0.84 to shareholders in the current quarter. While there is no guarantee that they will keep doing this in the future, history has shown that the firm has a good track record of maintaining and growing its dividends.
Check out JNJ’s dividend history chart to see for yourself.
Reasons Why a Stock May Have an Annualized Payout of $0
So, why might a stock have a payout of $0?
There are a number of possible reasons.
1. Irregular Dividends
The first reason a stock might have an annualized payout of $0 is if the firm pays dividends irregularly or sporadically.
If a stock usually pays quarterly dividends and if Dividend.com finds out that it was supposed to pay a dividend this quarter but they haven’t announced one yet, our code will mark the annualized payout as $0. This can happen with stocks that pay semiannual, annual or monthly dividends too – not just quarterly payers.
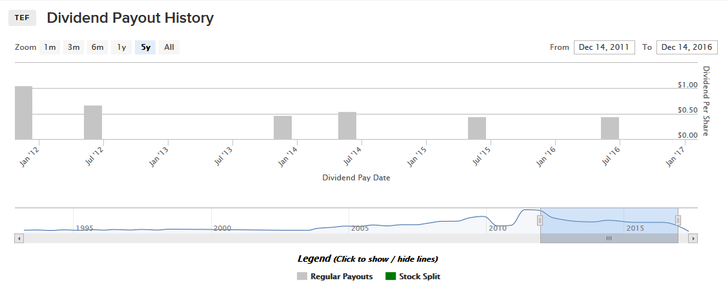
One example of this is Spanish Telecom giant Telefonica (TEF ). The company pays a dividend, but the lumpiness in its earnings and concerns about the European economy in the last few years have meant that this dividend is irregular.

Telefonica’s dividends have also been irregular in size in the last few years, and the firm has periodically paid out special dividends to shareholders. All of this adds up to a stock that might pay a dividend in the next year, but there is no guarantee.

Why do we at Dividend.com mark firms like Telefonica as having a $0 annualized payout? The answer is simple: as a dividend investor, your goal is steady income that is very predictable. If a company is irregular in its dividends then investors who buy stocks in order to generate income should avoid irregular dividend payers as an investment.
2. Dividend Suspensions
Irregular dividends are not the only reason that a firm might have an annualized payout of $0. If a stock suspends its dividend then the Dividend.com code would mark the annualized payout as $0.
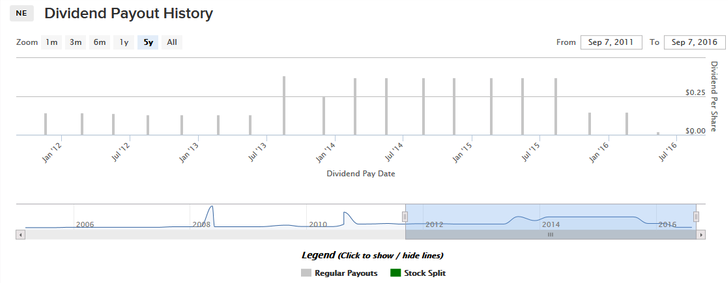
One industry that has seen a marked increase in the number of dividend suspensions in recent years is the energy sector. Take offshore driller Noble Energy (NE ) for instance. Noble was once a prominent dividend payer that offered investors significant reliable income. That all changed over the last couple of years as oil prices plunged and Noble’s balance sheet weakened. The firm cut its dividend in 2015, and then cut it again in 2016, before stopping dividend payments altogether.

Noble may begin paying dividends again after its business improves, but for now, the firm has an annualized payout of $0.
3. Special Dividends Not Being Annualized
Not all companies pay dividends, but even those firms that do pay dividends sometimes pay only special dividends. In these cases, investors may get rewarded by the firm, but the payout is too irregular and dependent on the company’s performance to rely on. In this case, we don’t annualize the special dividends, and hence the dividend and the yield continue to remain at $0 and 0%, respectively.
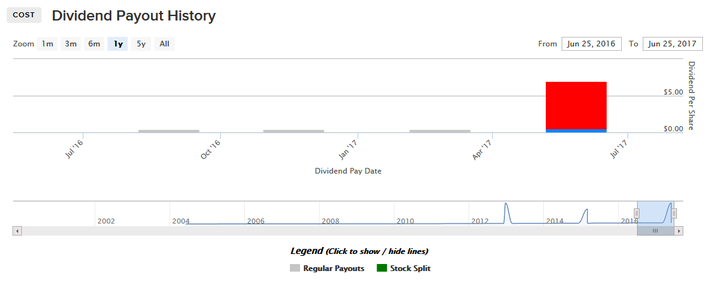
Membership club retailer Costco (COST ) is a great example of this. Costco is set to pay a huge $7.00 per share dividend to stockholders on May 26, 2017.

That dividend is decidedly out of the ordinary for the company though. As a result, Dividend.com does not count this special dividend in their regular annualized payout for the firm.

4. Non-Dividend Paying Companies
The most common type of firms with an annualized payout are firms that do not pay dividends. Alphabet, the parent company of web giant Google (GOOG) is a great example of this.

Dividend.com tracks many non-dividend paying companies in addition to dividend payers. Part of the reason for this is that we want to be able to start tracking any currently non-dividend paying company as soon as it declares a dividend. Keeping track of non-dividend payers that might begin paying in the future makes a lot of sense as a result.
There are many reasons a firm might choose not to pay a dividend. For example, recently listed companies often feel it is too risky to pay a dividend given that they are still figuring out how to navigate the public markets effectively. In other cases, established companies may simply not have a dividend-friendly policy, either because they prefer share buybacks or because they prefer to reinvest all of their profits into the existing business. Regardless of the reason, it is critical for investors to be able to differentiate between dividend payers and non-payers.
5. Stock Has Been Acquired/Stopped Trading or Went Bankrupt
Finally, many stocks that once paid dividends either have been acquired, gone private or gone bankrupt. Dividend.com still maintains ticker pages for these firms because it gives the user a useful dividend history and stock price history on the page. This can help with analysis on past investments or when comparing comparable firms to one another.
Still, the key point is that since the stock doesn’t exist anymore, you will see an annualized payout of $0 on the stock page. One example of this is Kraft Foods (KRFT). Once a major dividend payer, Kraft was bought by a private equity group that also owns Heinz and the stock is no longer traded.

The Bottom Line
There are many possible reasons a firm may have an annualized payout of $0. In these cases, the investor may still get a payout of some sort but they should not rely on it, and the likelihood of a payout is much lower than with a consistent dividend payer.
Dividend.com tracks over 6,500 securities. We have dividend data that goes as far back as 1993 for these securities. You can get access to all this data and also the Best Dividend Stocks list, which is made up of the highest-rated stocks according to our proprietary DARS rating system, by going premium for free.


