The Federal Reserve has hiked interest rates aggressively over the past year to fight inflation. While inflation has come down from 40-year highs, it remains well above the central bank’s 2% target rate.
Unfortunately, the central bank’s firepower may have limits. Higher interest rates are wreaking havoc on banks with long-dated Treasuries on their balance sheets. And most experts agree that a recession is likely over the coming quarters, which could force the Fed to ease up.
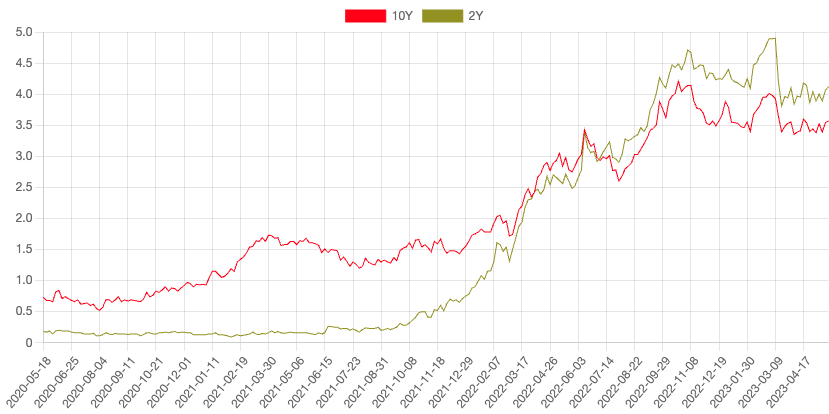
The result is an inverted yield curve where shorter-dated Treasuries offer higher yields than long-dated ones. And, as it turns out, inverted yield curves are a very telling sign of the future for investors.
Tougher Times Ahead? Maybe
The two- and 10-year yield curves had 28 inversions since the 1900s, and a recession followed 22 (79%) of these instances. During the last six downturns, a recession began six to 36 months after the curve inverted. And the latest inversion occurred during the middle of 2022, meaning it has been approximately 12 months.
The 2- and 10-Year Treasury yield curve remains inverted. Source: USTreasuryYieldCurve.com
That said, it’s important to remember that inverted yield curves don’t inherently cause a recession; it’s only a representation of investor expectations about the U.S. economy. In other words, the yield curve is only part of a broader picture that may determine if and when a recession occurs and how severe the recession could be.
Currently, the economy is performing relatively well despite higher interest rates. For example, while regional banks suffer from long-term Treasury holdings, the S&P 500 index is roughly 8% higher since January, unemployment remains near record lows, and consumer spending continues to rise despite slower wage growth.
Many large-cap companies have ample cash to avoid the impact of higher interest rates, and consumer spending remains robust. However, some industries that rely on debt and smaller companies that need capital raise have seen more of a slowdown. For instance, real estate was the worst-performing sector over the past 12 months.

Attractive Short-term Yields
Purchasing short-term Treasury bonds is the most obvious way to capitalize on higher short-term interest rates. With short-term rates near 40-year highs, these short-term bonds offer attractive risk-adjusted returns relative to other types of bonds or even some equities (given the potential for a recession over the coming quarters).
Several passive funds offer exposure to short-term Treasuries, including the iShares 1-3 Year Treasury Bond ETF (SHY) and the iShares 0-5 Year High Yield Corporate Bond ETF (SHYG). And even money market funds offer 4% yields in today’s market, providing investors with a very attractive low-risk source of income.
While these funds have lower expenses, investors may consider enlisting the help of active managers to navigate the rapidly changing market conditions. Fortunately, several active ETFs focus on short-term government and corporate bonds, where managers can avoid risks and use fundamental analysis to spot opportunities.
| Name | Ticker | Type | Active? | AUM | YTD Ret (%) | Expense |
| iShares Short Maturity Bond ETF | NEAR | ETF | Yes | $4.61B | 2% | 0.25% |
| PIMCO Active Bond ETF | BOND | ETF | Yes | $3.38B | 3.1% | 0.55% |
| American Century Diversified Corporate Bond ETF | KORP | ETF | Yes | $148M | 2.8% | 0.29% |
| Baird Short-Term Bond | BSBSX | Mutual Fund | Yes | $10.4B | 1.1% | 0.55% |
| PGIM Short-Term Corporate Bond | PSTQX | Mutual Fund | Yes | $11.7B | 1.5% | 0.38% |
Sectors Poised to Outperform
Specific sectors also tend to outperform when the yield curve inverts and the economy heads toward a recession. For example, utilities and consumer staples typically do well when the economy slows down. And while passive funds, like the Utilities Select SPDR Fund (XLU), offer exposure, active sector-rotation ETFs could provide better performance.
Sector rotation ETFs attempt to move money across industries based on the macroeconomic outlook. In today’s environment, managers using sector rotation strategies might decide to start moving into more defensive industries, like utilities, as the inverted yield curve signals a potential recession ahead over the coming quarters.
| Name | Ticker | Type | Active? | AUM | YTD Ret (%) | Expense |
| SPDR SSGA US Sector Rotation ETF | XLSR | ETF | Yes | $251M | 2.81% | 0.7% |
| Main Sector Rotation ETF | SECT | ETF | Yes | $1B | 5.18% | 0.75% |
| SPDR SSGA Fixed Income Sector Rotation ETF | FISR | ETF | Yes | $173M | 3.1% | 0.5% |
| Anfield US Equity Sector Rotation ETF | AESR | ETF | Yes | $106M | 5.1% | 1.12% |
| Sector Rotation Fund | NAVFX | Mutual Fund | Yes | $28M | 7.81% | 2.12% |
The Bottom Line
The inverted yield curve could foretell a recession over the next 24 months if history is any guide, although it’s far from a guarantee. Fortunately, you can prepare your portfolio to hedge against risk or capitalize on opportunities using the funds we’ve covered above.


