Whether you buy dividend stocks for long-term income, or are trading the stock for a capital gain—or both—when you buy and when you sell matters. Even long-term investors can benefit from improving their trade timing.
By utilizing technical support and resistance on your price charts you can better isolate your entry points, reducing the capital you invest; you still get the same dividend payments but you utilize less capital. That’s capital you can invest elsewhere, perhaps in another dividend stock. Improving your timing doesn’t have to be difficult either. Using horizontal and diagonal support and resistance you quickly and easily see when prices are likely to stop falling or rising, respectively.
Be sure to also see the 40 Things Every Dividend Investor Should Know About Dividend Investing.
Support and Resistance
Support levels are prices at which a stock stops declining, and theoretically buyers will enter to purchase the stock to push it higher. Resistance levels, on the other hand, are prices where the buying stops, selling begins and the price declines.
Support and resistance levels are based on past price history; therefore, it is important to understand that support or resistance levels don’t necessarily mean the price will stop at that level when it gets there again in the future. That said, support and resistance are still valuable tools, and can help forecast future price action. This is accomplished through understanding “horizontal” and “diagonal” support and resistance.
See also A Contrarian Approach to Dividend Investing: Low Price-to-Book Strategy.
Horizontal Support and Resistance Levels
When prices are within a range, moving repeatedly between two price areas, those two price areas are support and resistance. When a stock is within a range for a long period time, investors will look to buy near the low of the range – at support.
Purchasing at support provides several advantages:
- If the price stays within the range your risk is limited and you stand to make a capital gains profit as the price rises towards the upper portion of the range (resistance).
- Purchasing at a support level means you’re paying a lower price for the stock than if you purchased at resistance (high of the range). This means that the dividend payments you receive from the company will provide a higher return relative to your investment.
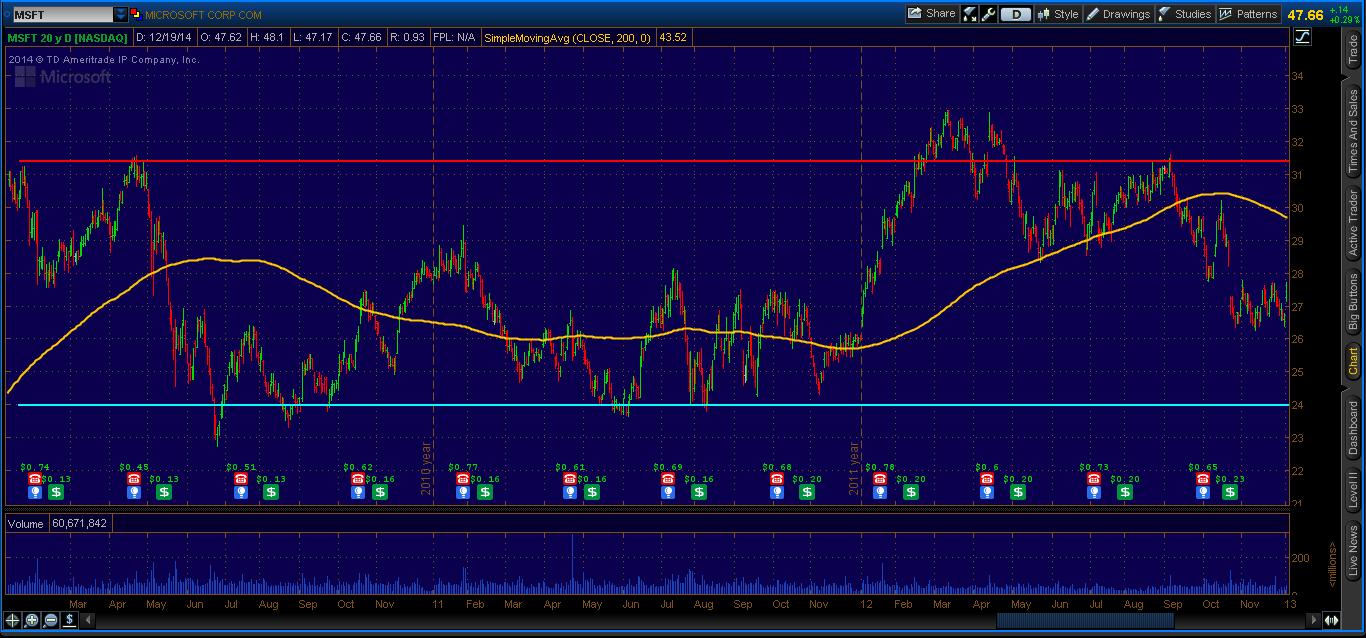
The chart of Microsoft Corporation (MSFT ), even though it had some aggressive moves higher and lower, moved in a predominantly sideways pattern from 2010 through 2012:

The support area (blue line) of the stock was $24 to $22.73 (2010 low) and the resistance area (red line) was between $31 and $32.95. Whether you purchased in the support or resistance area played a significant role in both capital gains and dividend returns.
In 2012 the company paid out a total of $0.83 in dividends per share. If you purchased in the support area, say $24, dividends alone provided a yield of 3.45% ($0.83 divided by $24). If you purchased at $31, in the resistance area, your dividend yield is only 2.68%.
Using horizontal support and resistance levels can help you isolate when to buy, and also when to sell. Selling the stock near resistance allows you to capture the price range the stock is moving in, and also collect any dividends that are paid while you own the stock.
The downside of using horizontal support and resistance is that the stock rarely moves to the exact price level it did before. Therefore, if you wait for the price to fall too much you may miss the opportunity to buy. Resistance is also not fixed – the stock may not move to the price you expect or it may move well beyond the prior resistance levels leaving you with a smaller profit than if you held on to it.
See also the Top 10 Myths About Dividend Investing.
Diagonal Support and Resistance Lines
When a stock price isn’t ranging, it is likely trending.
In an uptrend, the price is rising, which means support and resistance level are both moving up over time. In a downtrend, the price is falling and both the support and resistance are dropping over time. In both cases, support and resistance levels are indicated by a diagonal line, not a horizontal one.
When a stock price is in uptrend, waiting for the price to return to a former low point—as you do when the stock is ranging—it means you will likely miss your opportunity to buy as the price continues to move higher. Drawing a trendline, which connects at least two low points in price, helps isolate where support is likely to occur as the price rises. These support levels can then be used as buying opportunities.
Trendlines can be short-term or long-term. If you are a long-term investor, focus on multi-year charts and the overall trend of that period. Short-term trades can focus on smaller trends, which occur within years or months.
From the middle of 2010 through 2012, Pfizer Inc. (PFE ) was in an overall uptrend. Several smaller uptrends and downtrends also occurred over that time, as the different trendlines (red) show in the chart below:

Once again, buying near trendline support offers several advantages:
- During uptrend you are buying as the overall price movement of the stock is up, meaning you are likely to make capital gains on the stock
- Just like buying near horizontal support, buying near diagonal gets you in an advantageous price, which means a higher dividend yield than if you purchased at a higher price.
Similar to horizontal support and resistance levels, diagonal trendlines are not exact forecasts of where the price is likely to stop falling and start rising. Sometimes the price will move below the trendline or not touch it at all. Therefore, use the trendline only as a guide for a price area to buy.
Draw a long-term trendline to capture the overall trend, and then—if needed—draw multiple shorter-term trendlines to capture the smaller waves within the trend.
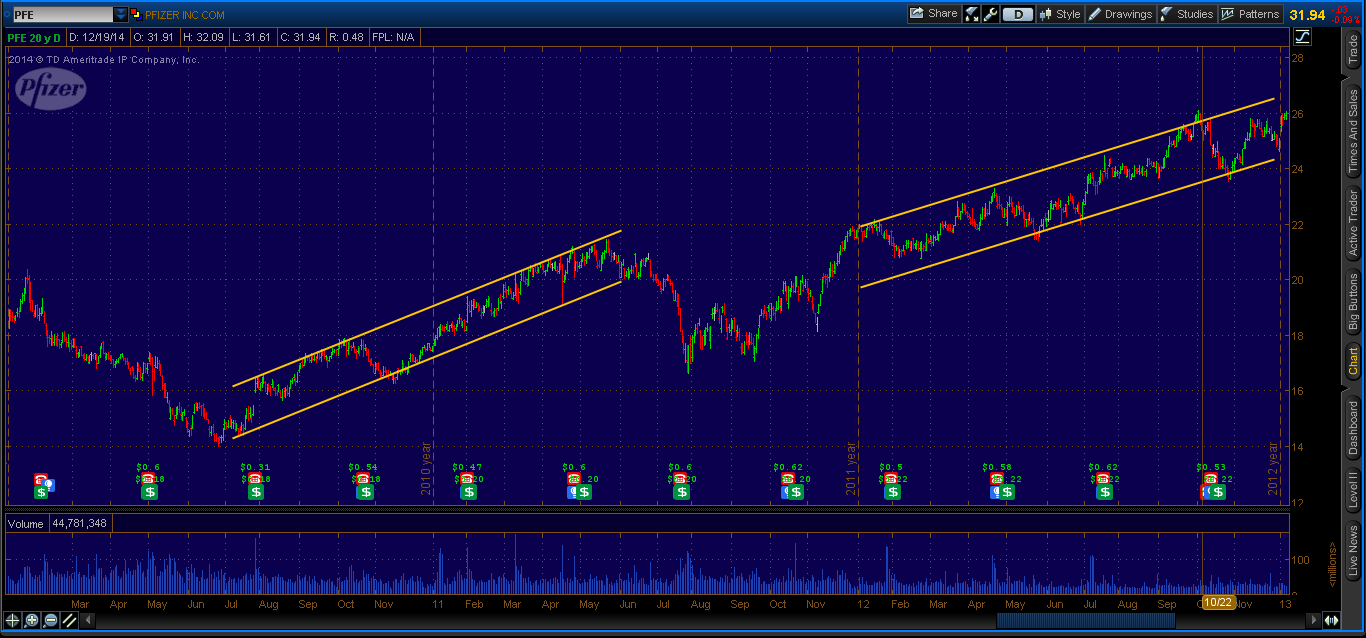
Trendlines are also used to connect “high points” in the stock. Drawing trendlines along both the price lows and price highs creates a “channel” that can be used to determine likely buy and sell points: Buy near the lower trendline, and sell near the upper trendline.
Be sure to also see The Unofficial Dividend.com Guide to Being an Investor.
The chart below from the same time frame shows several examples of short-term and longer-term channels (yellow lines) that occurred in Pfizer stock:

Buying at a support area marked by a trendline gives you favorable entry price in terms of capturing capital gains and also getting maximum yield from your dividends—the lower price you pay the higher your dividend yield. The downside is that a trend can reverse at any time, but the good news is your trendlines can warn you of such a reversal. If the price falls significantly below a long-term trendline it is likely the uptrend is over and it is time to sell, or avoid buying the stock, until it begins to show favorable uptrend movement as indicated by an upward sloping trendline.
The Bottom Line
Support and resistance are dynamic, constantly changing levels that indicate likely reversal points for a stock. Buying near support provides an advantageous price both for accumulating potential capital gains, and providing a more favorable dividend yield than if you purchased at a higher price. Resistance areas or trendlines can be used at exit areas. Using multiple support and resistance lines, both horizontal and vertical at the same time and on different time frames will give you better idea of where the market is in the overall longer-term trend or range, allowing you to make your buy and sell decisions with greater confidence.


