In last week’s Sunday newsletter we looked at how a specific narrative—China’s slowing growth—relates to the massive drop in crude oil over the last six months. Specifically, we looked at the data behind how big China’s economy has grown and how much incremental global GDP the economy adds, despite a slowing growth figure..
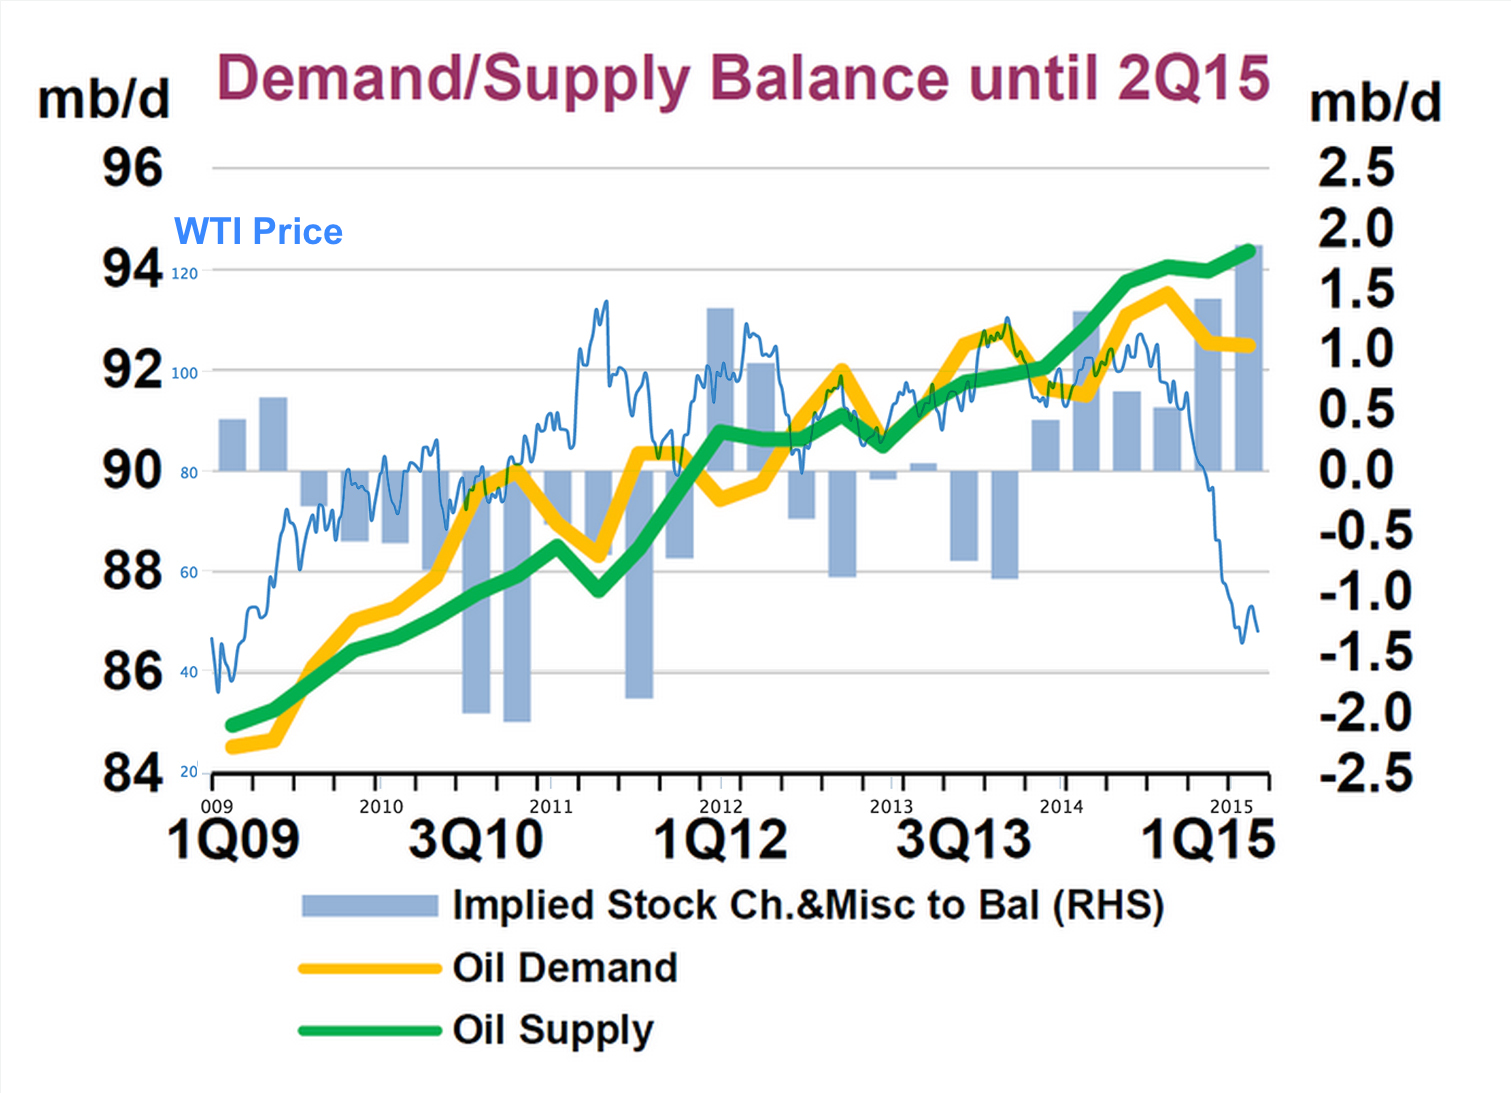
As noted last week, today we’ll focus on an intriguing question to which there is no easy answer: how does a 1.5 million barrels per day (mb/d) oversupply (approximately 1.7% of daily consumption) in world oil markets result in a 50% decline in the price of oil?
Let’s dive in!
The Data and Logic Gaps
As of the latest statistics available from the International Energy Agency (IEA), global supply of oil was 94.34 mb/d. Contrast this to 4Q demand of 93.53 mb/d, this creates a <1 mb/d oversupply. Of course, the market is a forward looking beast and in 1Q the IEA estimates 92.55 mb/d demand and best estimates of supply are at or slightly lower than the 94.34 mb/d in 4Q. This creates an approximate 1.5 mb/d gap in 1Q between oil supply and oil demand.
What's Happening Is Easy Though, Right? "Simple," in Fact...
Forgive us for being constantly skeptical, it’s in our nature. We see downside risk first and examine risk reward later. That said, we apply the same skepticism to any type of information we consume. For example, the New York Times notes that the drop in oil prices is “Simple Economics”. But is that right? On the surface (and I give the caveat that I’m no economist, I’m just armed with four university level economics classes and a healthy dose of teaching from the School of Hard Knocks), I question this. Here’s the rub: the oil market has experienced a number of instances where the supply / demand imbalance has been of equal magnitude , and these were not associated with the movement in the asset’s price. Our conclusion? It ain’t simple, there’s a whole lot more than economics going on here.

Market's Overshoot
In the chart above, the supply and demand of oil (and the spread between the two), as per figures from the IEA is charted. We’ve then taken the spot price of WTI over a similar time frame (notice there are two units of measurement on the y-axis: both mb/d and WTI price) and overlaid it on the supply and demand variances. What seems clear to us is the simple fact that too many economists forget: the world’s run by humans who are driven by fear and greed.
It is a simple and easily digestible sound bite and narrative to swallow that “oil’s drop is due to simple economics,” and while directionally that may be true, the fact is that markets are very rarely in perfect equilibrium. We’d argue that oil was overpriced at $107/b last summer and is likely underpriced at <$50/b in 1Q 2015. All that said, you need to play a long-term game and believe that the fundamentals will win. You also need to not employ leverage during these times of volatility, because if you do, and you’re wrong on timing, you could be in for big losses.
The Best Dividend Stock List
How does all this macro-economic hand waving manifest in value to our users? Our Best Dividend Stocks list. We see ‘blood on the streets’ in the oil market and want to be armed with the understanding and know-how of which companies might be staples in our investors’ portfolios if and when the balanced economics of the oil market return.
Be sure to follow us on @Dividenddotcom


