Introduction
Dividend.com analyzed the search patterns of visitors to our site during the past week ending March 05, 2016. Below, we give an analysis of how intelligently readers used Dividend.com to help them in their investment decision-making process by providing a breakdown of what was searched the most on Dividend.com ranked by volume spikes to ticker pages.

Equity Residential - Special Dividend
Equity Residential (EQR ) was trending last week as the REIT plummeted more than 10% after the company declared a special dividend of $8 per share. The special dividend only equates to a yield of more than 11% on the current market price of $71.47. This price represents a very good buying opportunity because there is nothing actually wrong with the business. The price drop was a normal adjustment any stock would go through after it declares a hefty special dividend.
The company is growing its FFO at a CAGR of 8.7%. If we assume that the same growth rate continues, it leads to a forward P/FFO of 20.66 for 2016 and 19.13 for 2017. Compare that to their peer media valuation which stands at 21.44.
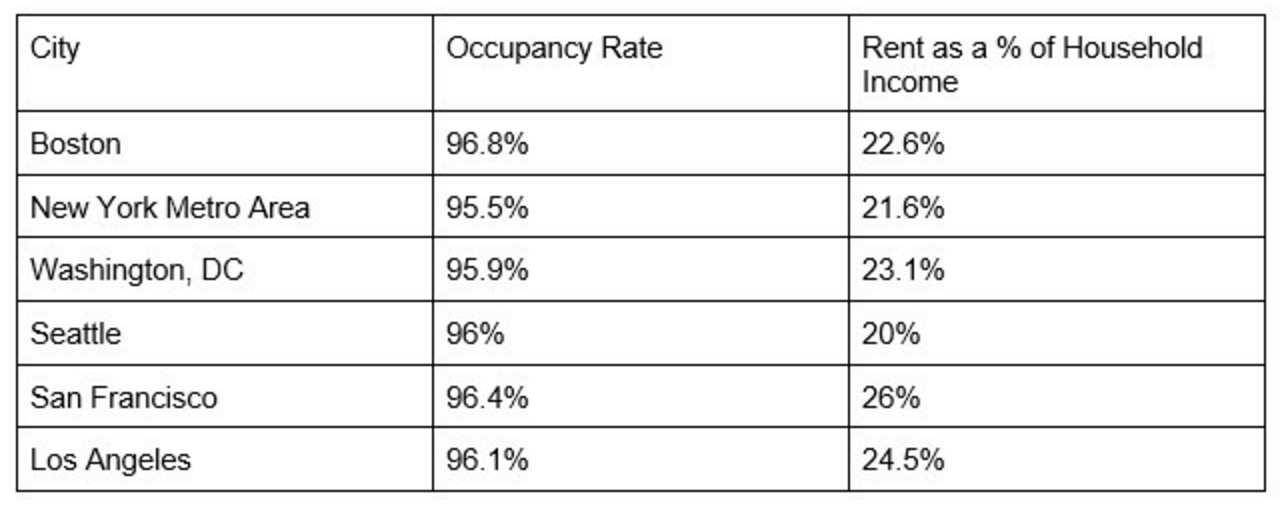
Equity Residential owns and operates a portfolio of apartment assets in the public apartment space. They have a high geographic concentration in Boston, New York, Washington DC, Southern California, San Francisco and Seattle.
Millennials and post-millennials are Equity Residential’s primary clients. Nearly 4 million people are turning 25 each year and they are the demographic with the highest probability to rent an apartment as they move to big cities to be part of the knowledge economy.

EQR has extremely high occupancy levels in their core market.
Read our detailed report on EQR (available only for premium members).
Utilities & Industrials
Our Utilities and Industrials pages were trending last week since both these sectors have been on a tear as the markets most recent rally is largely seen as a “suckers rally” by many.
The general market perception on utilities and industrial stocks is that they are overpriced. The perception is right when the majority of the stocks in these two sectors are trading at a forward PE of 20-25.
There are two reasons why utilities and industrials have defied market perceptions.
- Stocks from these two sectors are serial dividend payers who have extremely stable business models. When you want to own a company that has a stupendous record of not only paying dividends but increasing their payouts year-over-year, you will have to pay a slight premium to the market. You can’t expect the stock to trade around 17 PE, which is the valuation Dow Industrial index gets as of today.
- The market slams high growth companies over companies that give modest growth whenever it falls with gravity. Most of the utilities and Industrials are estimated to grow at a modest rate of 5% to 9% next year.
Top 14 Performing Utilities Stocks
| Ticker | Industry | *Estimated EPS Growth FY2017 end | *P/EPS |
|---|---|---|---|
| (EIX ) | Electric Utilities | 5.67% | 17.45 |
| (WTR ) | Water Utilities | 5.97% | 23.55 |
| (IDA ) | Electric Utilities | 3.34% | 18.64 |
| (SJW) | Water Utilities | 6.32% | 21.37 |
| (AWK ) | Water Utilities | 7.80% | 24.07 |
| (ATO ) | Gas Utilities | 7.03% | 21.62 |
| (SWX ) | Gas Utilities | 6.90% | 19.74 |
| (EE ) | Electric Utilities | 3.97% | 16.45 |
| (PNM ) | Diversified Utilities | 17.18% | 20.18 |
| (MGEE ) | Diversified Utilities | 6.73% | 22.16 |
| (UGI ) | Diversified Utilities | 11.71% | 18.85 |
| (ITC) | Electric Utilities | 7.14% | 20.19 |
| (CPK ) | Gas Utilities | 7.07% | 20.11 |
| (NJR ) | Gas Utilities | 8.59% | 21.34 |
*PE – price/calendar year 2016 EPS estimate
*Calendar year 2016 EPS estimate is compared to calendar year 2017 EPS estimate
The companies mentioned above are solid dividend paying utilities which haven’t fallen down as 2016 started. As you can see, most of the companies are estimated to give a growth rate of 5% to 9% next year after adjusting for outliers while trading at a PE of 20.
Top 10 performing Industrials Stocks
| Ticker | Industry | *Estimated EPS Growth FY2017 end | *P/EPS |
|---|---|---|---|
| (ITW ) | Diversified Machinery | 9.14% | 17.86 |
| (RSG ) | Waste Management | 8.37% | 21.9 |
| (XYL ) | Diversified Machinery | 9.50% | 19.11 |
| (IEX ) | Diversified Machinery | 9.32% | 21.41 |
| (GGG ) | Diversified Machinery | 8.72% | 22.26 |
| (HON ) | Aerospace-Defense Products & Services | 9.98% | 16.36 |
| (WM ) | Waste Management | 6.83% | 20.56 |
| (BIN) | Waste Management | 17.21% | 24.93 |
| (NOC ) | Aerospace-Defense Products & Services | 16.62% | 18.68 |
| (PH ) | Industrial Equipment & Components | 6.56% | 17.66 |
*PE – price/ calendar year 2016 EPS estimate
*Calendar year 2016 EPS estimate is compared to calendar year 2017 EPS estimate
The same pattern can be seen in industrial stocks that are paying dividends. Modest estimated growth rates are valued slightly higher by the markets because they aren’t as aggressively shorted as high growth stocks when there is blood on the streets.
Dividend.com was quick to upgrade an industrial stock and a utilities stock in 2016, which have both given a 6% and 9% return so far, excluding the dividends.
The Bottom Line
We at Dividend.com know how technology is interwoven in our daily lives. Dividend.com has become a central source of information for all things dividends on Wall Street. By analyzing how you, our valued readers, search our property, we hope to uncover important trends that help forecast stock market performance. Each week, we’ll share search patterns from the previous week in order to assist you in making insightful decisions for your portfolio.


