Did you know that technology and communications, two GIC sectors that used to be combined as one, now together represent 38% of the S&P 500? This is neither good nor bad, just a factor that drives portfolio decision making by investors and active portfolio managers. The change was announced in 2017 and went into effect on September 28, 2018. This basically modernized the S&P 500, and arguably made investors more vulnerable to higher multiple stocks that also warranted greater growth rates to justify their valuations. Again, neither good nor bad – just an opinion. In the ETF Think Tank, we often discuss with financial advisors how to capture growth and different factors when building portfolios. In this new series written for MutualFunds.com, we focus on how “Structure Matters,” which simply highlights how security selection, much like the ingredients in a recipe, make up portfolio construction.
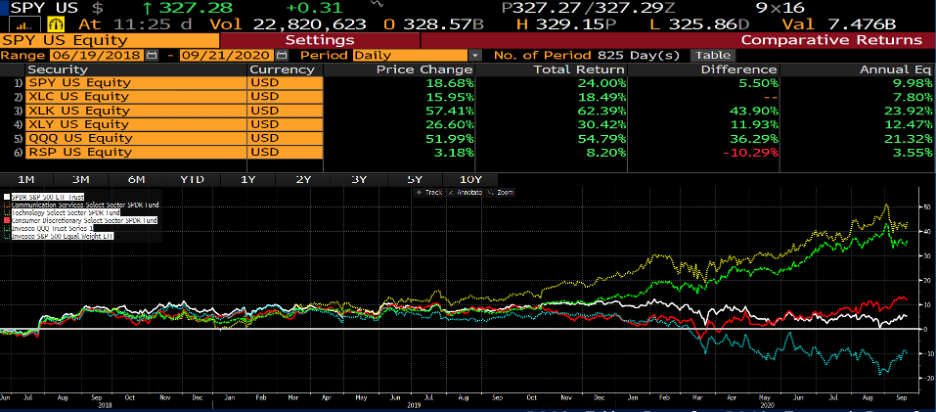
To appreciate the context of the discussion around how Structure Matters, we thought we would go back to basics with the S&P 500. Broadly speaking, it is not complicated to say that the S&P 500 is most investors’ and portfolio managers’ benchmark, or at least their yard stock. Something like $11 Trillion is benchmarked against this index, so it is clearly important.
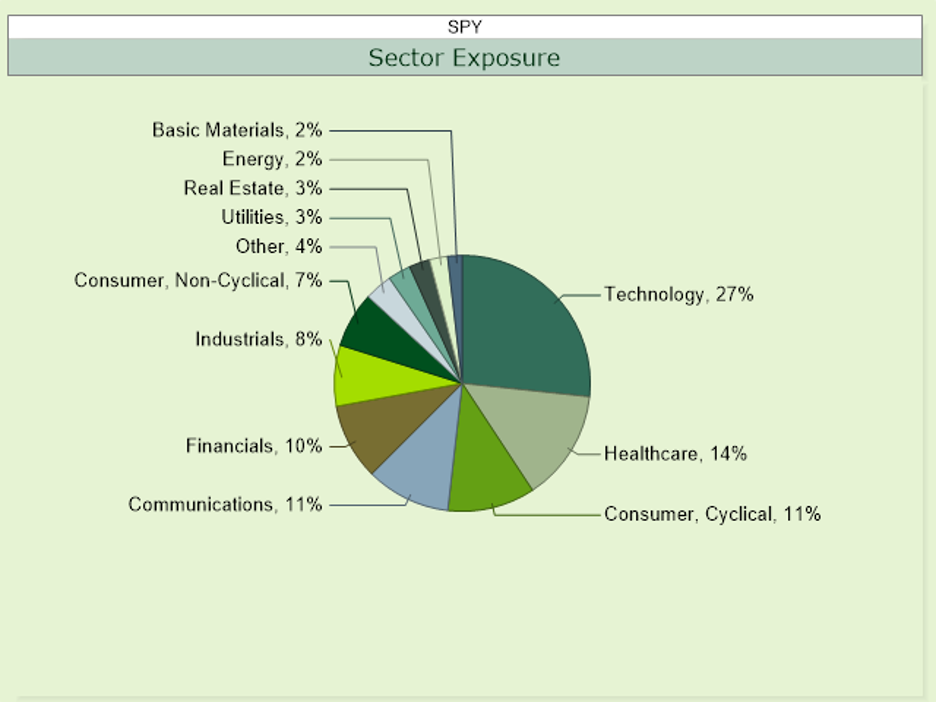
In order to break down and appreciate the makeup of what has happened in technology, we need to look deeper and see how the basic price to multiple (PE Multiple) now trades in this leading sector. Using the index on Bloomberg (IXTTR Index) that leads the technology ETF, the Technology Select Sector SPDR ETF (XLK), we illustrate how earnings expectations are high for this sector that currently trades at 30.91x, which is 27.25 times Year End Estimates, and 23.56 times 2021 estimates. Fair or not, this is evidence of expectations which have been historically priced in a range of 18-22×. On September 9, 2020, we wrote about how Apple (AAPL) stock when it had a market value of $2 Trillion, or about two times its historical PE multiple (see link: Burton Malkeil, ESG and Expectations of 12% Returns). This is important math because as an overweighted index position it has arguably made its price performance somewhat self-fulfilling so long as it continues to exceed profit expectations. Put differently, indexes that are market cap weighted have two important characterizations – they have survivorship bias, and their winners rise to the top. With that in mind as we write this article, Apple’s stock is about 6.4% of the S&P 500 Index, and Microsoft’s is 5.6%. Amazon and Facebook are the second two largest positions, at 4.7% and 2.22%. See complete holdings for SPY here. When the large falter or provide a digestion proble as an important ingredient to a recipe, is that a failure of a short-term phenomenon? Time will tell whether Apple’s September 2, 2020 high of almost $138 will be revisited, but watch for earnings on October 30th?
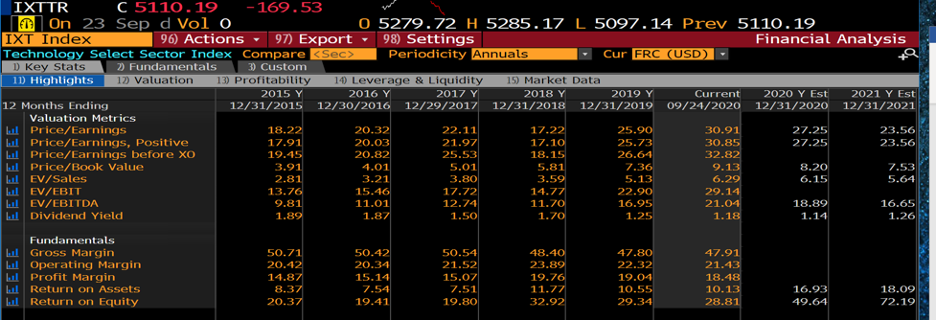
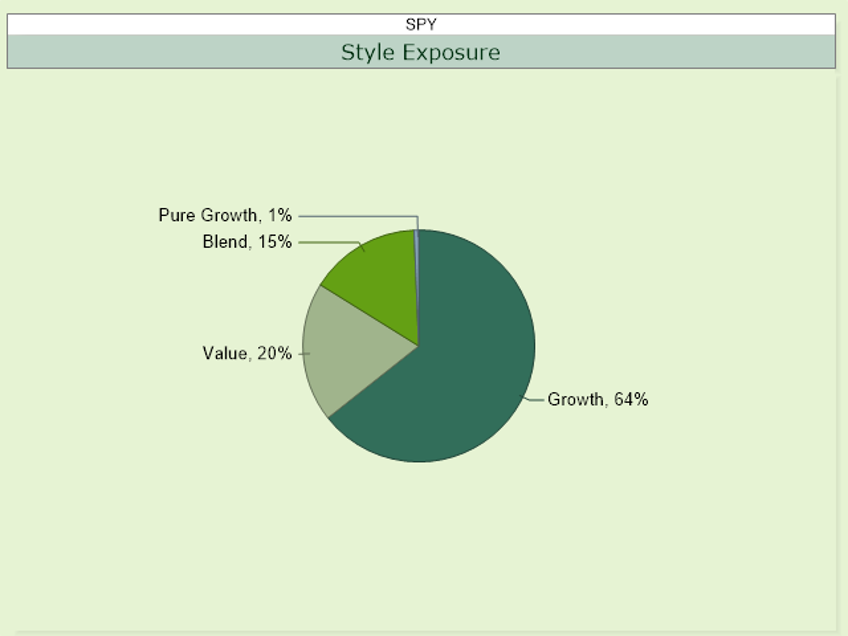
Our work on high “Active Share” in the ETF Think Tank leads us to breakdown the makeup of the S&P 500 in different ways, but again, let’s stay basic. The other chart also helps to highlight how, according to XTF, the S&P 500 should be viewed as a blended allocation with a meaningful bias towards growth.
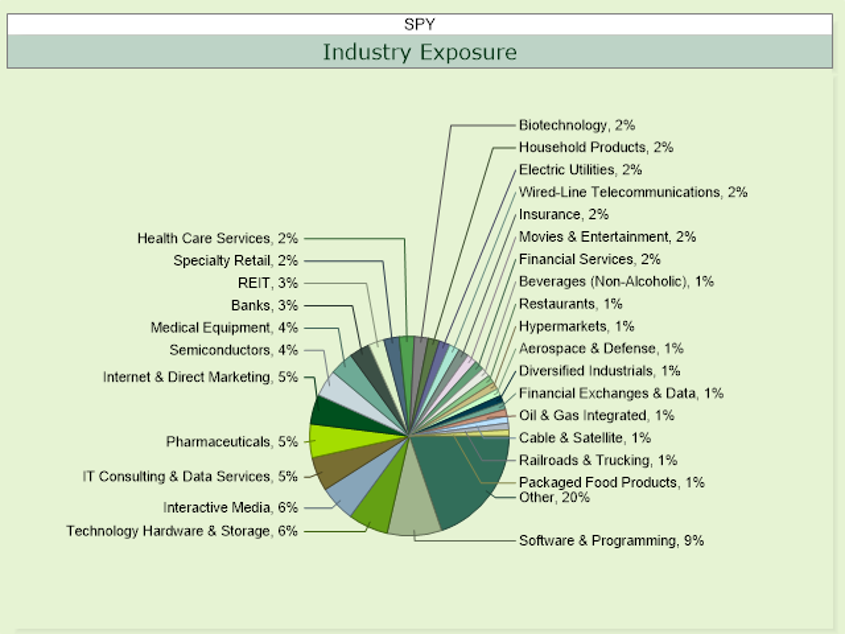
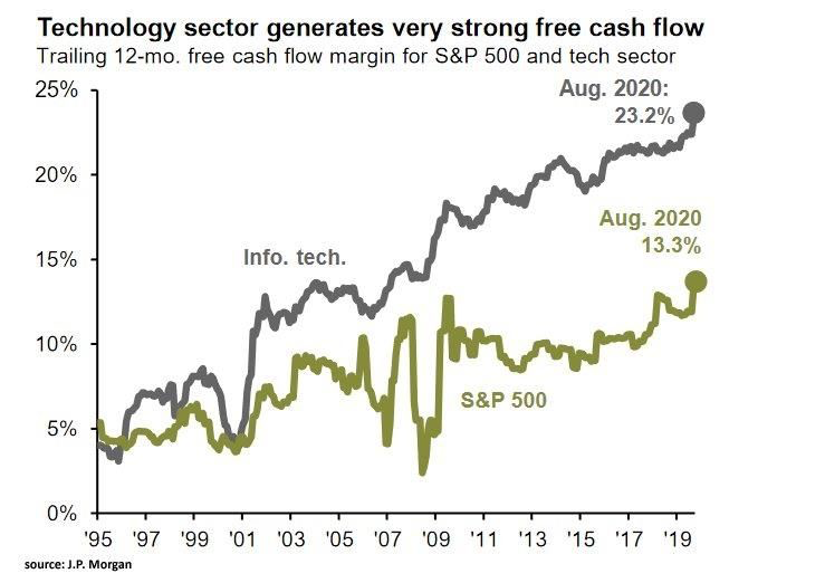
Arguably, technology as a sector has its fundamental strengths as a factor. Margins are very wide versus the S&P 500, and where success occurs, it is usually followed by characterizations that can be both “moat like” or disruptive to other business drivers (see JP Morgan chart below for illustration). Again, this is why we think investors need to pay more attention to technology than basic industries in their portfolios. However, the question that most investors are grappling with is: How much large cap technology exposure do they really need to drive growth in their portfolio? Thematic ETFs, of course, play to that question. However, what may surprise people to find out is that low volatility indexes also may be overweighted towards technology.
Conclusion
Most investors recognize that market performance lately, as measured by the S&P 500, has been driven by the Top 5 leading technology companies. We do not believe that this is neither good nor bad, but an important question to be asking regarding portfolio construction. Active decisions around passive solutions is part of the decision-making process for investors. Index committee decisions have their own process for rebalancing, but the question is whether or not that process works in an individual portfolio strategy designed for that investor that literally owns the decision. We do not know the rate of growth that Apple and Tesla stock will capture in the future, and market cap weightings do not always address this specific target beyond the presumptions made behind the Efficient-Market Theory. However, given the tools we have as ETF Nerds we can’t help, but seek to build better portfolios that more rationally target growth prospects beyond simply being better because they are bigger! In our next piece, we will touch on sectors and thematic as part of this solution.
Contact Dan Weiskopf at [email protected] or follow him on Twitter at @etfProfessor.
It is important that all readers review the below disclosure and manage their own risk. These comments should not be considered investment advice. Critical disclosure link: https://torosoam.com/general-disclosure
The ETF Think Tank is a community of advisors focused on a client-centric approach to investing through the use of ETFs. Each week, we disseminate research on the growth of the ETF industry, including key performance indicators (KPIs) on number of ETFs listed, assets, revenue, exchange market share and number of issuers. This data is useful in serving to monitor the trends in the ETF ecosystem. ETF Think Tank produces this monthly report for ETF.com. For questions about joining please reach out to Dan Weiskopf @ETFProfessor or at [email protected] or sign up for a 1:1 due diligence call here.


