Factor investing has become an important theme for investing. It allows an investor to determine what parts of their investments are driving return. It’s not only important to determine what is driving your investment return but how you are obtaining a particular factor exposure. Growth is a critical factor when investing.
It can be challenging to identify growth within the market, especially without overpaying for it. There are several investment tools available for investors to gain exposure to growth.
There are actively managed strategies that utilize “black box” models, and there are passively managed, rules-based strategies. The difficulty with investing in actively managed strategy is the lack of transparency, “key man” risk, and higher fees. Whereas, with rule-based strategies, it is critical that investors understand the built-in investment strategy within that particular strategy.
One investment managing giant is Dimensional Fund Advisors (“DFA”). They have built a reputation around targeted, rules-based strategies over its 40-year history. They manage nearly $514 billion, of which about $2.5 billion is in their U.S. Large Cap Growth Portfolio (“DUSLX”). Fundamentally, their growth strategy looks at two components: high valuation ratios and high profitability.
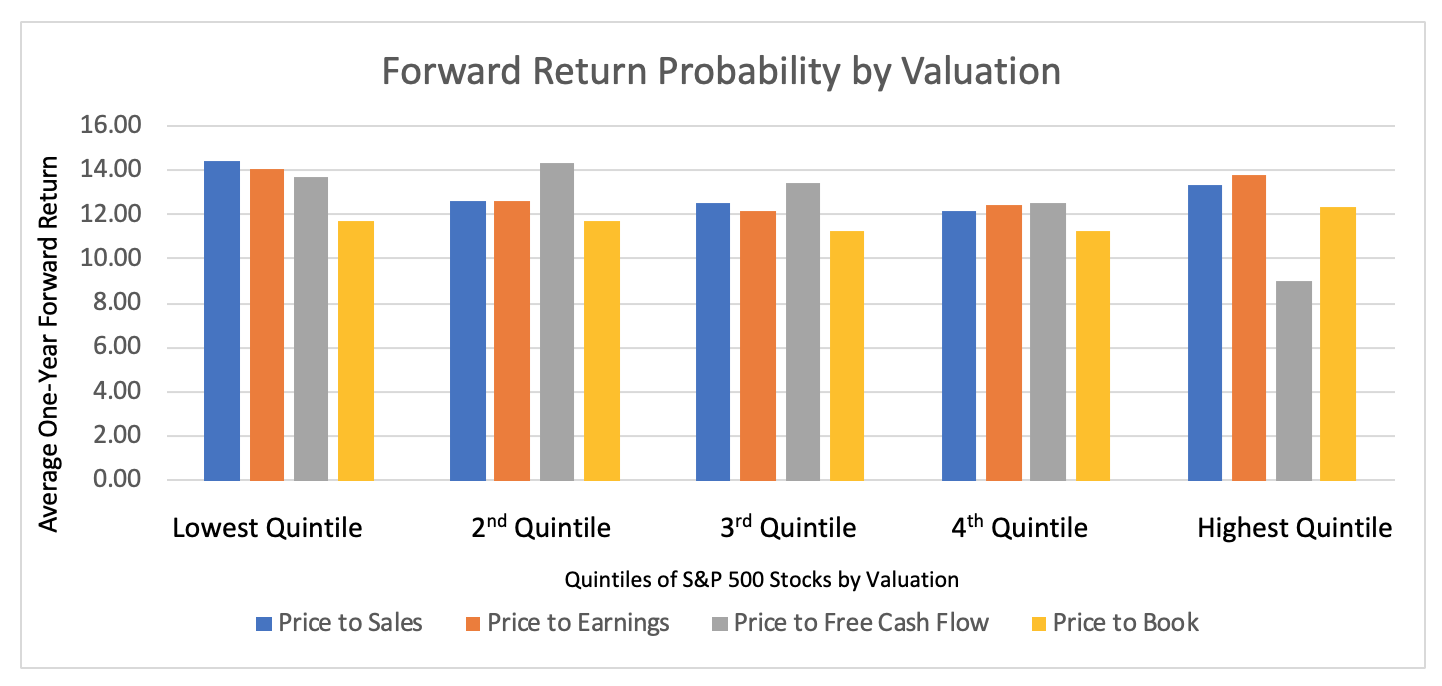
The fallacy around choosing companies with high valuation ratios is that the exposure to those securities tend to lead to lower forward looking returns. Below is a chart illustrating forward looking returns for each valuation metric: price to sales, price to earnings, price to free cash flow, and price to book. The “lowest quintile” represents securities in the S&P 500 Index with the lowest valuation ratios and the “highest quintile” represents securities in the S&P 500 Index with the highest valuation ratios.

Data from Factset Research systems from 1/1/90 through 3/31/20
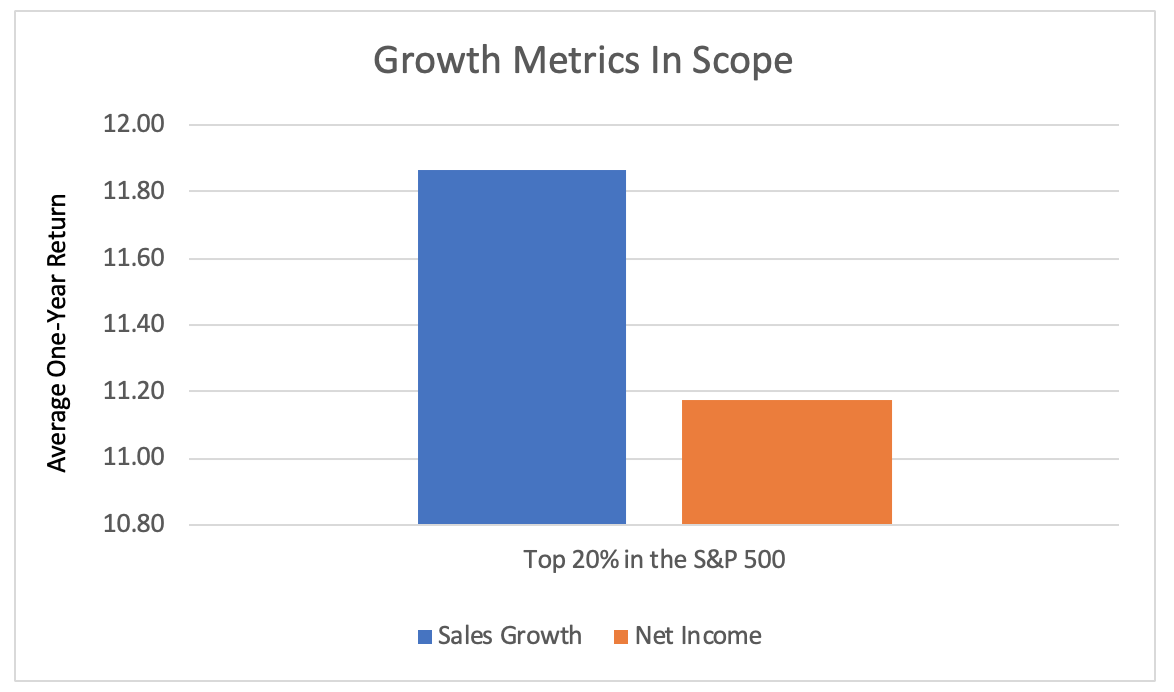
You’ll notice that stocks with lower valuations in general perform better than those with higher valuations. As mentioned, DFA’s growth portfolio then looks at profitability. Based on our research, profitability is generally a weak indicator of return growth. Our thesis is that when investors are looking for exposure to growth, there is a higher tolerance for lack of profitability if a company is showing strong demand through the growth of its sales. Below is a chart that looks at the S&P 500 Index, narrowed by securities in the top 20% by year over year sales growth and net income.

Data from Factset Research systems from 03/31/95 through 3/31/20
As you can see, companies with the highest net income demonstrated a weak return outlook when compared to sales growth, prevailing our theory that capturing growth companies based on sales appears superior to that of profitability. This research in part led us to develop our index, the Global Beta Momentum-Growth Index. Our index narrows the S&P 500 Index by companies with what we believe to be strong year over year sales growth. We believe this screen optimizes our portfolio to result in a basket of securities with the most optimal growth exposure. Consequently, by using sales as a metric to obtain our portfolio, we found that it reduces our exposure to high valued companies, particularly as measured by price to sales. We believe this is due to the fact that we are selecting securities that are growing the metric that is effectively the denominator in price to sales.
The Power of Price to Sales
Why is price to sales an important barometer for forward investment outlook? Factors such as earnings, book value, and free cash flow can be influenced through different accounting methods. Price to sales is potentially more reliable because, in contrast to the aforementioned factors, sales cannot be influenced by general accounting practices. Sales is effectively the life blood of an organization, and the growth of which is critical to the viability of a company. Thus, it stands to reason that a valuation multiple that measures a company’s price relative to sales will likely provide the greatest indication of how over or under priced that particular stock is.
As illustrated in the “Forward Return Probability by Valuation” chart, we can see how much of a leading indicator a low price to sales multiple can be. We believe this is very relevant when considering growth as it can be difficult to gain exposure to growth without overpaying for it. We believe our portfolio effectively changes that dynamic. Below is the performance of our Global Beta Momentum-Growth Index versus DFA’s Growth Portfolio.

Data from Factset Research Systems as of 06/30/20
The performance of the resulting portfolios proves out the aforementioned research. It is important to note that the Global Beta Momentum-Growth Index has been live since the start of 2020, therefore, we believe that the performance is live evidence that selecting securities by sales growth and consequently reducing your price to sales multiple is superior to looking at securities with higher valuations and profitability. What we have found here, which is critical to long term success when investing in growth, is that sales is a critical barometer for measuring growth, and that it enables an investor exposure at a relatively better valuation.
Conclusion
It is critical that investors understand the importance of valuation when positioning in any factor of the market. We believe utilizing a targeted, factor-based investment strategy that focuses on metrics that naturally improve relative valuations, such as what we have done with the Global Beta Momentum-Growth Index, will allow investors to improve their return probability without chasing frothy market valuations or paying lofty active management fees that may have large capital gains associated with them.
Justin Lowry is the Chief Investment Officer for Global Beta Advisors, in Philadelphia, PA.


